Every public number we rely on across this site, in one place, with its source and years. Middlesex had 49 fatal large-truck crashes in 2019–2024 (NHTSA FARS) and 3,724 reportable truck and bus crashes in 2021–2025 (FMCSA). The Turnpike has the most crashes, Route 1 the most deaths.
Garces, Grabler & LeBrocq, P.C. · Edison · New Brunswick · Perth Amboy · AVAILABLE 24/7
49 / 54
fatal crashes involving a large truck in Middlesex, and people killed
2019–2024, NHTSA FARS (2024 preliminary)
3,724
federally reportable truck and bus crashes; 47 fatal, 2,052 injured
2021–2025, FMCSA crash file
12%
of New Jersey's 418 fatal large-truck crashes happened in Middlesex, more than in any of the other four counties we cover
2019–2024, NHTSA FARS
5,347
active federally registered motor carriers are based in Middlesex County
FMCSA Company Census, pulled September 29, 2026
Every table below is dated. Involving a truck does not mean the truck caused the crash. The tables describe the county; they do not decide any case. For your own crash, the numbers that matter are in the police report and the trucking company's records, and that is where Garces, Grabler & LeBrocq, P.C. starts.
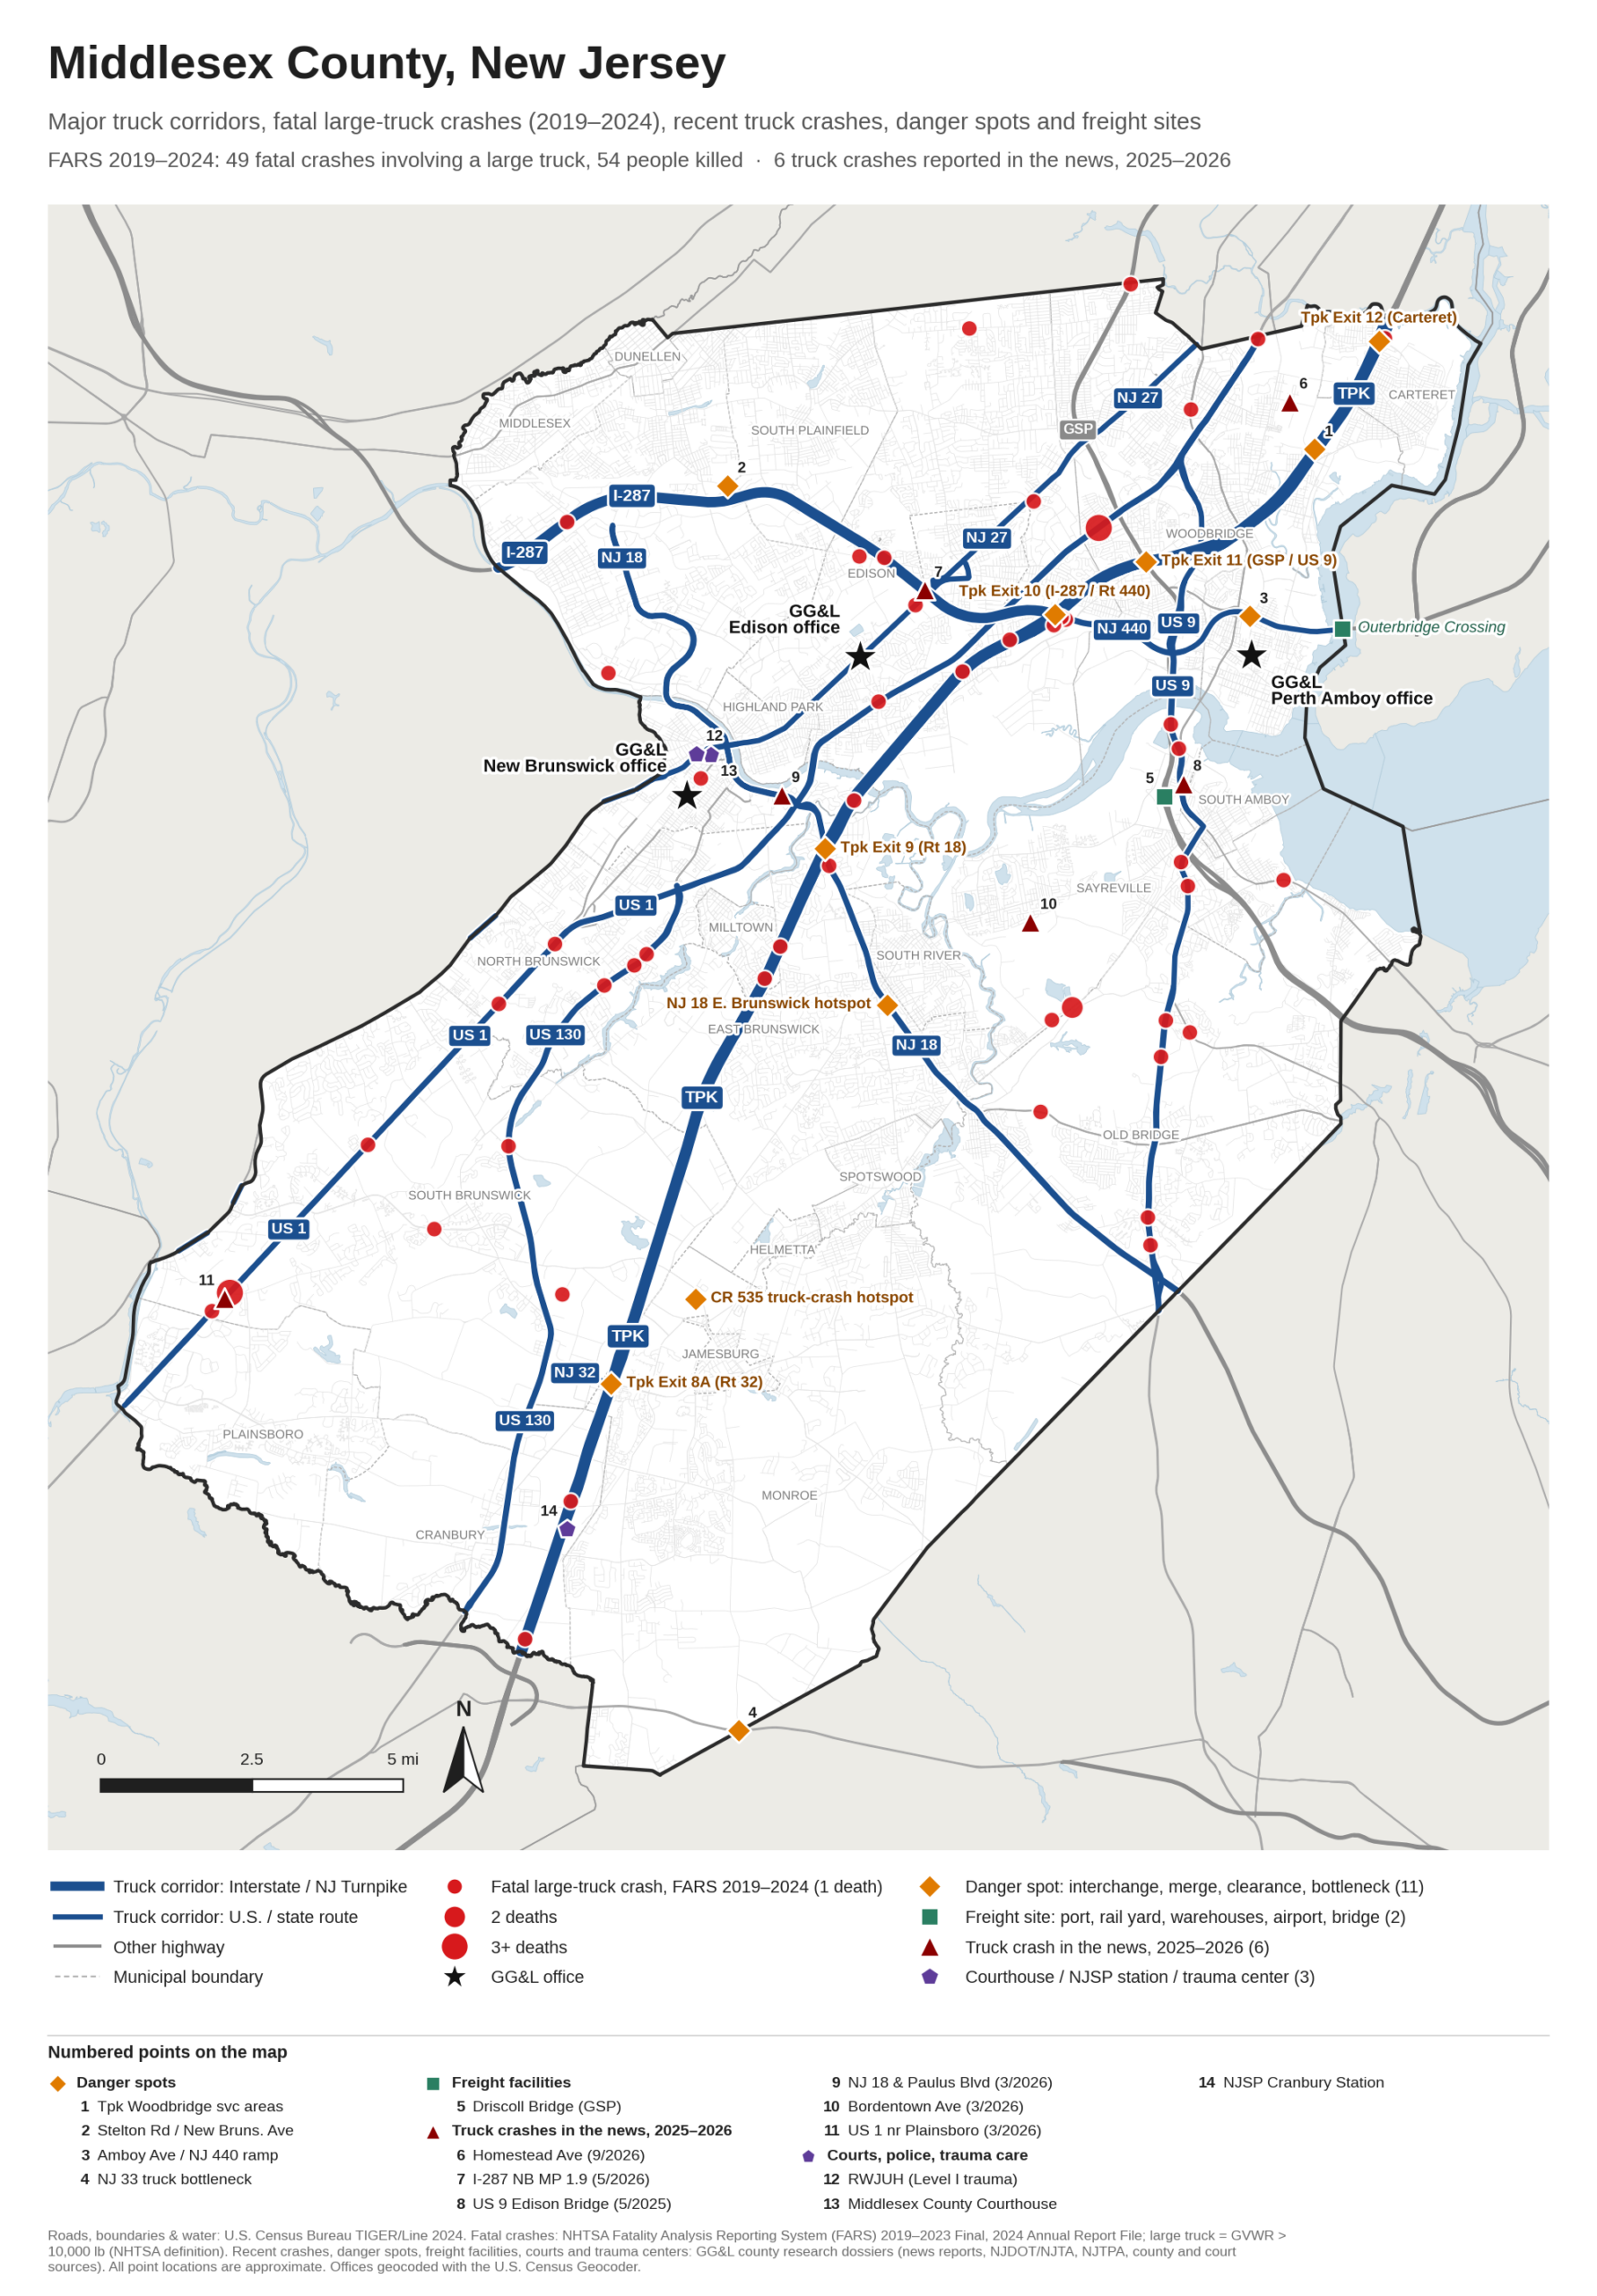
Middlesex County truck corridors, fatal large-truck crashes 2019–2024 (NHTSA FARS: 2019–2023 Final, 2024 Annual Report File), recent news crashes, danger spots, freight sites and GGL offices. Base geography: Census TIGER/Line 2024. All point locations are approximate and are for illustration, not scene locations. Click a road for its corridor page.
A1. Fatal crashes involving a large truck, by year
Year
Crashes
Deaths
Truck occupants killed
Other-vehicle occupants killed
Pedestrians killed
Cyclists killed
Crashes involving a truck-tractor
2019
12
14
3
8
3
0
8
2020
6
6
1
3
1
1
5
2021
7
7
0
7
0
0
4
2022
13
13
3
10
0
0
7
2023
4
5
0
4
1
0
2
2024*
7
9
1
6
1
1
3
Total
49
54
8
38
6
2
29
Source: NHTSA FARS, 2019–2023 Final files and 2024 Annual Report File (*preliminary; NHTSA replaces it with a Final file about a year later). A large truck is a truck over 10,000 lb GVWR under NHTSA's body-type definition; buses are counted separately. Fatal counts are small, so year-to-year swings are noise. Involving a truck does not mean the truck caused the crash.
A2. Fatal large-truck crashes by road
Road
Crashes
Deaths
Years with a fatal crash
I-95 / NJ Turnpike
9
9
2019, 2020, 2022, 2023, 2024
US 1
8
12
2019, 2021, 2022, 2024
US 9
8
8
2019, 2020, 2021, 2022, 2023, 2024
US 130
4
4
2019, 2021, 2022
I-287
2
2
2024
NJ 35
2
2
2020, 2022
NJ 440
2
2
2020, 2021
Bordentown Ave
1
2
2023
13 other roads, 1 crash each
13
13
2019–2024
Source: NHTSA FARS 2019–2024, Middlesex County, road normalized from the FARS trafficway field. Route 9 is the only road with a fatal crash in every year. Involving a truck does not mean the truck caused the crash.
Fatal large-truck crashes by municipality
Municipality
Crashes
Deaths
Edison
11
11
Sayreville
7
8
South Brunswick
6
8
Old Bridge
6
6
North Brunswick
5
5
Woodbridge
4
6
Cranbury
2
2
East Brunswick
2
2
New Brunswick
2
2
Piscataway
2
2
Carteret
1
1
Milltown
1
1
Source: NHTSA FARS 2019–2024. Municipality is the Census county subdivision containing the FARS coordinates, which can be off by several hundred feet; a crash on the Turnpike coded to Milltown, for example, reflects the coordinates, not a Milltown street. Involving a truck does not mean the truck caused the crash.
Who died, and when
Measure
Count
Occupants of other vehicles
38 of 54 deaths
Occupants of the truck
8 of 54 deaths
Pedestrians
6 of 54 deaths
Cyclists
2 of 54 deaths
Crashes in the dark
28 of 49 crashes
Crashes involving a truck-tractor (semi)
29 of 49 crashes
Front-to-rear collisions
16 of 49 crashes
Source: NHTSA FARS 2019–2024, 49 Middlesex crashes. 46 of the 54 people killed were outside the truck. Involving a truck does not mean the truck caused the crash.
A3. Reportable truck and bus crashes, by year (fatal, injury or tow-away)
Year
Crashes
Fatal crashes
Injury crashes
People killed
People injured
Truck crashes
Bus crashes
2021
635
6
244
6
344
597
40
2022
731
16
324
17
463
662
73
2023
803
8
314
9
422
727
79
2024
849
7
303
11
432
766
91
2025*
706
10
292
10
391
643
67
2021–2025 total
3,724
47
1,477
53
2,052
3,395
350
2026 YTD*
519
8
180
9
254
—
—
Source: FMCSA Crash File (MCMIS), Middlesex County, pulled September 29, 2026. A crash is federally reportable when a truck over 10,000 lb, a bus or a placarded hazmat vehicle is involved and someone dies, someone is taken for treatment, or a vehicle is towed for disabling damage. *2025 and especially 2026 (through September 14) are incomplete because state uploads lag. The truck/bus split is not available for 2026. Involving a truck does not mean the truck caused the crash.
A4. Reportable truck and bus crashes by road
Road
Crashes
Fatal crashes
Injury crashes
People killed
People injured
I-95 / NJ Turnpike
638
10
227
11
317
US 1
449
8
186
10
261
US 9
339
8
137
8
217
NJ 18
178
2
63
2
80
I-287
161
2
77
2
107
US 130
115
5
57
7
84
CR 535
94
0
32
0
38
CR 514
82
0
34
0
39
NJ 27
81
1
36
1
54
NJ 35
77
2
36
2
48
NJ 440
72
2
32
2
43
CR 529 (Stelton Rd)
49
0
16
0
16
CR 522 (Ridge Rd)
44
1
15
1
20
Garden State Parkway
30
1
11
1
18
Source: FMCSA Crash File, Middlesex County, 2021–2025. Road names are free text on the police report, so this grouping is approximate and the counts are a floor; crashes on ramps are often coded to the road being joined. Each road links to its corridor page below. Involving a truck does not mean the truck caused the crash.
Reportable truck and bus crashes by town
Town
Crashes
Fatal crashes
Edison
694
8
Woodbridge
580
9
South Brunswick
362
7
East Brunswick
293
5
Old Bridge
241
4
North Brunswick
217
4
Piscataway
195
0
Sayreville
195
7
New Brunswick
178
0
Source: FMCSA Crash File, Middlesex County, 2021–2025. Town names as written on reports were merged (for example “Edison Twp” and “Edison”). Towns with fewer than 178 crashes are not shown; the full list is in the data pack. Involving a truck does not mean the truck caused the crash.
Cargo body type of trucks and buses in reportable crashes
Cargo body
Vehicles
Share
Van / enclosed box
2,249
54.8%
Dump
381
9.3%
Flatbed
284
6.9%
Bus, 16+ seats
236
5.8%
Not applicable
207
5.0%
Intermodal container chassis
174
4.2%
Cargo tank
127
3.1%
Other
124
3.0%
Bus, 9–15 seats
117
2.9%
Garbage / refuse
81
2.0%
Auto transporter
51
1.2%
Pole
44
1.1%
Concrete mixer
9
0.2%
Unknown
7
0.2%
Grain / chips / gravel
6
0.1%
Vehicle towing another vehicle
5
0.1%
All vehicles
4,102
100%
Source: FMCSA Crash File, Middlesex County, 2021–2025; 4,102 vehicles. One crash can involve more than one truck. Enclosed van and box bodies, the warehouse and delivery fleet, are more than half. Involving a truck does not mean the truck caused the crash.
Vehicle configuration of trucks and buses in reportable crashes
Configuration
Vehicles
Share
Tractor / semitrailer
1,637
39.9%
Single-unit truck, 2 axles, 6 tires
1,308
31.9%
Single-unit truck, 3+ axles
470
11.5%
Bus, 16+ seats
236
5.8%
Truck tractor only (bobtail)
170
4.1%
Truck with trailer
135
3.3%
Bus, 9–15 seats
117
2.9%
Unknown
13
0.3%
Tractor / double trailer
12
0.3%
Tractor / triple trailer
3
0.1%
Light truck with hazmat placard
1
0.0%
All vehicles
4,102
100%
Source: FMCSA Crash File, Middlesex County, 2021–2025; 4,102 vehicles. Tractor-semitrailers are two in five. Involving a truck does not mean the truck caused the crash.
All police-reported crashes, 2022: Middlesex against the other counties we cover
County
All crashes
Truck-involved crashes
Truck-involved: fatal
Truck-involved: injury
Truck-involved: property damage only
Killed / injured in truck-involved crashes
Middlesex
25,051
3,252
17
464
2,771
17 / 615
Bergen
25,919
3,197
7
407
2,783
7 / 527
Essex
26,676
2,868
7
341
2,520
10 / 452
Union
18,074
2,549
3
335
2,211
3 / 431
Morris
10,840
1,231
7
163
1,061
7 / 221
New Jersey
242,551
25,676
101
3,431
22,144
109 / 4,534
Source: our tabulation of NJDOT's 2022 statewide crash data files (the latest year NJDOT has published; its public raw data lags three to four years). Truck-involved means at least one vehicle coded NJTR-1 type 20–27 or 29. Middlesex had the most truck-involved crashes of the five counties. Involving a truck does not mean the truck caused the crash.
All traffic deaths in Middlesex County (every vehicle type), New Jersey State Police
Period
Fatal crashes
Fatalities
Drivers
Passengers
Cyclists
Pedestrians
Statewide fatalities
2023 (full year)
57
59
28
9
2
20
606
2024 (full year)
54
60
27
11
1
21
684
2025 (full year)
49
49
27
6
1
15
582
2026 through Sept. 29
35
36
23
4
1
8
395
Source: NJSP Fatal Accident Investigation Unit, year-to-date victim classification by county, as of September 29, 2026. These counts are unofficial and subject to change, and they are not truck-specific. Refreshed quarterly.
Motor carriers based in Middlesex County
Measure
Count
Active carriers with a Middlesex business address
5,347
Of which report at least one power unit
5,162
Interstate carriers
3,083
For-hire carriers
3,648
Hazardous-materials carriers
394
Carriers with 10 or more power units
391
Carriers with 100 or more power units
24
Power units, all carriers (excluding one implausible record)
23,639
Drivers, all carriers
25,261
Source: FMCSA Company Census File, snapshot pulled September 29, 2026; active carriers with a Middlesex physical address. Figures are self-reported on Form MCS-150, and the business address is not necessarily where the trucks are garaged. Utilities, waste haulers and leasing companies are included because they operate trucks. Many are private or intrastate fleets that do not appear in FMCSA's public insurance filings. Carrier names are withheld on this site.
Middlesex's share of New Jersey's fatal large-truck crashes
Year
New Jersey crashes
Middlesex crashes
Middlesex share
2019
69
12
17%
2020
49
6
12%
2021
82
7
9%
2022
99
13
13%
2023
57
4
7%
2024*
62
7
11%
Total
418
49
12%
Source: NHTSA FARS 2019–2024 (*2024 preliminary), our tabulation for New Jersey (STATE = 34) and Middlesex. An earlier statewide tabulation in our research files shows 83 and 100 crashes for 2021 and 2022; the figures here (82 and 99) use the refined large-truck definition and are the ones used site-wide. Involving a truck does not mean the truck caused the crash.
What counts as a large truck. In the FARS tables, a large truck is a vehicle with a body type NHTSA classifies as a truck over 10,000 lb GVWR (step vans, single-unit straight trucks, truck-tractors and medium or heavy pickups), following the FARS Analytical User's Manual. Buses are flagged separately and are not in the large-truck counts. Only vehicles in transport are counted.
What counts as reportable. The FMCSA tables count crashes that New Jersey uploaded to the federal Motor Carrier Management Information System: a truck over 10,000 lb, a bus or a placarded hazmat vehicle was involved, and someone died, someone was taken for treatment, or a vehicle was towed for disabling damage. Property-damage-only crashes with no tow are not included. Crashes are counted once by report number even when several trucks were involved.
Why the fatal counts differ. FARS counts 49 fatal large-truck crashes in 2019–2024; FMCSA counts 47 fatal truck and bus crashes in 2021–2025. The years, the vehicle definitions and the county coding differ, so the two will never match exactly. Neither is wrong.
Road names are approximate. The location on a police report is free text. “Route 1,” “US 1” and “Rt 1 NB” were grouped by hand; a crash on a ramp may be coded to either road. Counts by road are therefore floors.
Involving a truck does not mean the truck caused the crash. None of these files assigns fault. FMCSA's file includes crashes it has not reviewed for preventability, and the carrier-involvement counts in our research files track how many miles a fleet drives, not how safely.
Dates. FARS 2024 is the preliminary Annual Report File and can change; there is no 2025 FARS file yet. FMCSA 2025 and 2026 are incomplete because uploads lag. NJDOT's public raw crash data stops at 2022. NJSP's fatal counts are unofficial until each case is closed. The carrier census is a snapshot pulled September 29, 2026. Everything on this page is as of September 2026 and is refreshed quarterly.
The map. Crash points use FARS coordinates as reported, which can be off by several hundred feet; interchange points are intersections of Census TIGER/Line 2024 centerlines; news-crash and danger-spot points were placed from the sources named in our research and snapped to the road geometry.
What's hard to do alone
The public data lags. NJDOT's raw crash data stops at 2022, FARS 2024 is preliminary, and FMCSA's current year is incomplete. None of it will tell you what happened in your crash.
Your case runs on two records these tables do not contain: the police crash report, with the responsible carrier's USDOT number in Boxes 50–52, and the carrier's own files, which federal rules let it discard on a schedule (electronic logs after six months, inspection reports after three).
The carrier's history is public but scattered. Its crash and inspection record sits in FMCSA's systems under its USDOT number, not under the name painted on the truck.
Garces, Grabler & LeBrocq, P.C.
What GGL does for you here
Pulls the carrier's FMCSA crash and inspection history by USDOT number from the police report, for your case rather than for the county
Orders the police report and, where needed, the State Police serious/fatal file by subpoena
Sends the trucking company a preservation letter before its records can be discarded
Identifies the responsible carrier, broker, lessor and insurer
Call Today For A Free Consultation
The numbers describe the county. Your case depends on your report and the carrier's records. Call (201) 252-7848. No Fee Unless GGL Wins.
How often do truck crashes happen in Middlesex County, and where? This page collects every public number we rely on across this site, in one place and with its source and years attached. Middlesex had 49 fatal crashes involving a large truck in 2019–2024, killing 54 people, about 12% of New Jersey's 418 such crashes (NHTSA FARS). It had 3,724 federally reportable truck and bus crashes in 2021–2025, with 47 fatal and 2,052 people injured (FMCSA crash file). The Turnpike has the most crashes, Route 1 the most deaths, and Route 9 a fatal truck crash in every year.
Garces, Grabler & LeBrocq, P.C. · Edison · New Brunswick · Perth Amboy · AVAILABLE 24/7
49 / 54
fatal crashes involving a large truck in Middlesex, and people killed
2019–2024, NHTSA FARS (2024 preliminary)
3,724
federally reportable truck and bus crashes; 47 fatal, 2,052 injured
2021–2025, FMCSA crash file
12%
of New Jersey's 418 fatal large-truck crashes happened in Middlesex, more than in any of the other four counties we cover
2019–2024, NHTSA FARS
5,347
active federally registered motor carriers are based in Middlesex County
FMCSA Company Census, pulled September 29, 2026
Every table below is dated. Involving a truck does not mean the truck caused the crash. The tables describe the county; they do not decide any case. For your own crash, the numbers that matter are in the police report and the trucking company's records, and that is where Garces, Grabler & LeBrocq, P.C. starts.
Middlesex County truck corridors, fatal large-truck crashes 2019–2024 (NHTSA FARS: 2019–2023 Final, 2024 Annual Report File), recent news crashes, danger spots, freight sites and GGL offices. Base geography: Census TIGER/Line 2024. All point locations are approximate and are for illustration, not scene locations. Click a road for its corridor page.
A1. Fatal crashes involving a large truck, by year
Year
Crashes
Deaths
Truck occupants killed
Other-vehicle occupants killed
Pedestrians killed
Cyclists killed
Crashes involving a truck-tractor
2019
12
14
3
8
3
0
8
2020
6
6
1
3
1
1
5
2021
7
7
0
7
0
0
4
2022
13
13
3
10
0
0
7
2023
4
5
0
4
1
0
2
2024*
7
9
1
6
1
1
3
Total
49
54
8
38
6
2
29
Source: NHTSA FARS, 2019–2023 Final files and 2024 Annual Report File (*preliminary; NHTSA replaces it with a Final file about a year later). A large truck is a truck over 10,000 lb GVWR under NHTSA's body-type definition; buses are counted separately. Fatal counts are small, so year-to-year swings are noise. Involving a truck does not mean the truck caused the crash.
A2. Fatal large-truck crashes by road
Road
Crashes
Deaths
Years with a fatal crash
I-95 / NJ Turnpike
9
9
2019, 2020, 2022, 2023, 2024
US 1
8
12
2019, 2021, 2022, 2024
US 9
8
8
2019, 2020, 2021, 2022, 2023, 2024
US 130
4
4
2019, 2021, 2022
I-287
2
2
2024
NJ 35
2
2
2020, 2022
NJ 440
2
2
2020, 2021
Bordentown Ave
1
2
2023
13 other roads, 1 crash each
13
13
2019–2024
Source: NHTSA FARS 2019–2024, Middlesex County, road normalized from the FARS trafficway field. Route 9 is the only road with a fatal crash in every year. Involving a truck does not mean the truck caused the crash.
Fatal large-truck crashes by municipality
Municipality
Crashes
Deaths
Edison
11
11
Sayreville
7
8
South Brunswick
6
8
Old Bridge
6
6
North Brunswick
5
5
Woodbridge
4
6
Cranbury
2
2
East Brunswick
2
2
New Brunswick
2
2
Piscataway
2
2
Carteret
1
1
Milltown
1
1
Source: NHTSA FARS 2019–2024. Municipality is the Census county subdivision containing the FARS coordinates, which can be off by several hundred feet; a crash on the Turnpike coded to Milltown, for example, reflects the coordinates, not a Milltown street. Involving a truck does not mean the truck caused the crash.
Who died, and when
Measure
Count
Occupants of other vehicles
38 of 54 deaths
Occupants of the truck
8 of 54 deaths
Pedestrians
6 of 54 deaths
Cyclists
2 of 54 deaths
Crashes in the dark
28 of 49 crashes
Crashes involving a truck-tractor (semi)
29 of 49 crashes
Front-to-rear collisions
16 of 49 crashes
Source: NHTSA FARS 2019–2024, 49 Middlesex crashes. 46 of the 54 people killed were outside the truck. Involving a truck does not mean the truck caused the crash.
A3. Reportable truck and bus crashes, by year (fatal, injury or tow-away)
Year
Crashes
Fatal crashes
Injury crashes
People killed
People injured
Truck crashes
Bus crashes
2021
635
6
244
6
344
597
40
2022
731
16
324
17
463
662
73
2023
803
8
314
9
422
727
79
2024
849
7
303
11
432
766
91
2025*
706
10
292
10
391
643
67
2021–2025 total
3,724
47
1,477
53
2,052
3,395
350
2026 YTD*
519
8
180
9
254
—
—
Source: FMCSA Crash File (MCMIS), Middlesex County, pulled September 29, 2026. A crash is federally reportable when a truck over 10,000 lb, a bus or a placarded hazmat vehicle is involved and someone dies, someone is taken for treatment, or a vehicle is towed for disabling damage. *2025 and especially 2026 (through September 14) are incomplete because state uploads lag. The truck/bus split is not available for 2026. Involving a truck does not mean the truck caused the crash.
A4. Reportable truck and bus crashes by road
Road
Crashes
Fatal crashes
Injury crashes
People killed
People injured
I-95 / NJ Turnpike
638
10
227
11
317
US 1
449
8
186
10
261
US 9
339
8
137
8
217
NJ 18
178
2
63
2
80
I-287
161
2
77
2
107
US 130
115
5
57
7
84
CR 535
94
0
32
0
38
CR 514
82
0
34
0
39
NJ 27
81
1
36
1
54
NJ 35
77
2
36
2
48
NJ 440
72
2
32
2
43
CR 529 (Stelton Rd)
49
0
16
0
16
CR 522 (Ridge Rd)
44
1
15
1
20
Garden State Parkway
30
1
11
1
18
Source: FMCSA Crash File, Middlesex County, 2021–2025. Road names are free text on the police report, so this grouping is approximate and the counts are a floor; crashes on ramps are often coded to the road being joined. Each road links to its corridor page below. Involving a truck does not mean the truck caused the crash.
Reportable truck and bus crashes by town
Town
Crashes
Fatal crashes
Edison
694
8
Woodbridge
580
9
South Brunswick
362
7
East Brunswick
293
5
Old Bridge
241
4
North Brunswick
217
4
Piscataway
195
0
Sayreville
195
7
New Brunswick
178
0
Source: FMCSA Crash File, Middlesex County, 2021–2025. Town names as written on reports were merged (for example “Edison Twp” and “Edison”). Towns with fewer than 178 crashes are not shown; the full list is in the data pack. Involving a truck does not mean the truck caused the crash.
Cargo body type of trucks and buses in reportable crashes
Cargo body
Vehicles
Share
Van / enclosed box
2,249
54.8%
Dump
381
9.3%
Flatbed
284
6.9%
Bus, 16+ seats
236
5.8%
Not applicable
207
5.0%
Intermodal container chassis
174
4.2%
Cargo tank
127
3.1%
Other
124
3.0%
Bus, 9–15 seats
117
2.9%
Garbage / refuse
81
2.0%
Auto transporter
51
1.2%
Pole
44
1.1%
Concrete mixer
9
0.2%
Unknown
7
0.2%
Grain / chips / gravel
6
0.1%
Vehicle towing another vehicle
5
0.1%
All vehicles
4,102
100%
Source: FMCSA Crash File, Middlesex County, 2021–2025; 4,102 vehicles. One crash can involve more than one truck. Enclosed van and box bodies, the warehouse and delivery fleet, are more than half. Involving a truck does not mean the truck caused the crash.
Vehicle configuration of trucks and buses in reportable crashes
Configuration
Vehicles
Share
Tractor / semitrailer
1,637
39.9%
Single-unit truck, 2 axles, 6 tires
1,308
31.9%
Single-unit truck, 3+ axles
470
11.5%
Bus, 16+ seats
236
5.8%
Truck tractor only (bobtail)
170
4.1%
Truck with trailer
135
3.3%
Bus, 9–15 seats
117
2.9%
Unknown
13
0.3%
Tractor / double trailer
12
0.3%
Tractor / triple trailer
3
0.1%
Light truck with hazmat placard
1
0.0%
All vehicles
4,102
100%
Source: FMCSA Crash File, Middlesex County, 2021–2025; 4,102 vehicles. Tractor-semitrailers are two in five. Involving a truck does not mean the truck caused the crash.
All police-reported crashes, 2022: Middlesex against the other counties we cover
County
All crashes
Truck-involved crashes
Truck-involved: fatal
Truck-involved: injury
Truck-involved: property damage only
Killed / injured in truck-involved crashes
Middlesex
25,051
3,252
17
464
2,771
17 / 615
Bergen
25,919
3,197
7
407
2,783
7 / 527
Essex
26,676
2,868
7
341
2,520
10 / 452
Union
18,074
2,549
3
335
2,211
3 / 431
Morris
10,840
1,231
7
163
1,061
7 / 221
New Jersey
242,551
25,676
101
3,431
22,144
109 / 4,534
Source: our tabulation of NJDOT's 2022 statewide crash data files (the latest year NJDOT has published; its public raw data lags three to four years). Truck-involved means at least one vehicle coded NJTR-1 type 20–27 or 29. Middlesex had the most truck-involved crashes of the five counties. Involving a truck does not mean the truck caused the crash.
All traffic deaths in Middlesex County (every vehicle type), New Jersey State Police
Period
Fatal crashes
Fatalities
Drivers
Passengers
Cyclists
Pedestrians
Statewide fatalities
2023 (full year)
57
59
28
9
2
20
606
2024 (full year)
54
60
27
11
1
21
684
2025 (full year)
49
49
27
6
1
15
582
2026 through Sept. 29
35
36
23
4
1
8
395
Source: NJSP Fatal Accident Investigation Unit, year-to-date victim classification by county, as of September 29, 2026. These counts are unofficial and subject to change, and they are not truck-specific. Refreshed quarterly.
Motor carriers based in Middlesex County
Measure
Count
Active carriers with a Middlesex business address
5,347
Of which report at least one power unit
5,162
Interstate carriers
3,083
For-hire carriers
3,648
Hazardous-materials carriers
394
Carriers with 10 or more power units
391
Carriers with 100 or more power units
24
Power units, all carriers (excluding one implausible record)
23,639
Drivers, all carriers
25,261
Source: FMCSA Company Census File, snapshot pulled September 29, 2026; active carriers with a Middlesex physical address. Figures are self-reported on Form MCS-150, and the business address is not necessarily where the trucks are garaged. Utilities, waste haulers and leasing companies are included because they operate trucks. Many are private or intrastate fleets that do not appear in FMCSA's public insurance filings. Carrier names are withheld on this site.
Middlesex's share of New Jersey's fatal large-truck crashes
Year
New Jersey crashes
Middlesex crashes
Middlesex share
2019
69
12
17%
2020
49
6
12%
2021
82
7
9%
2022
99
13
13%
2023
57
4
7%
2024*
62
7
11%
Total
418
49
12%
Source: NHTSA FARS 2019–2024 (*2024 preliminary), our tabulation for New Jersey (STATE = 34) and Middlesex. An earlier statewide tabulation in our research files shows 83 and 100 crashes for 2021 and 2022; the figures here (82 and 99) use the refined large-truck definition and are the ones used site-wide. Involving a truck does not mean the truck caused the crash.
What counts as a large truck. In the FARS tables, a large truck is a vehicle with a body type NHTSA classifies as a truck over 10,000 lb GVWR (step vans, single-unit straight trucks, truck-tractors and medium or heavy pickups), following the FARS Analytical User's Manual. Buses are flagged separately and are not in the large-truck counts. Only vehicles in transport are counted.
What counts as reportable. The FMCSA tables count crashes that New Jersey uploaded to the federal Motor Carrier Management Information System: a truck over 10,000 lb, a bus or a placarded hazmat vehicle was involved, and someone died, someone was taken for treatment, or a vehicle was towed for disabling damage. Property-damage-only crashes with no tow are not included. Crashes are counted once by report number even when several trucks were involved.
Why the fatal counts differ. FARS counts 49 fatal large-truck crashes in 2019–2024; FMCSA counts 47 fatal truck and bus crashes in 2021–2025. The years, the vehicle definitions and the county coding differ, so the two will never match exactly. Neither is wrong.
Road names are approximate. The location on a police report is free text. “Route 1,” “US 1” and “Rt 1 NB” were grouped by hand; a crash on a ramp may be coded to either road. Counts by road are therefore floors.
Involving a truck does not mean the truck caused the crash. None of these files assigns fault. FMCSA's file includes crashes it has not reviewed for preventability, and the carrier-involvement counts in our research files track how many miles a fleet drives, not how safely.
Dates. FARS 2024 is the preliminary Annual Report File and can change; there is no 2025 FARS file yet. FMCSA 2025 and 2026 are incomplete because uploads lag. NJDOT's public raw crash data stops at 2022. NJSP's fatal counts are unofficial until each case is closed. The carrier census is a snapshot pulled September 29, 2026. Everything on this page is as of September 2026 and is refreshed quarterly.
The map. Crash points use FARS coordinates as reported, which can be off by several hundred feet; interchange points are intersections of Census TIGER/Line 2024 centerlines; news-crash and danger-spot points were placed from the sources named in our research and snapped to the road geometry.
What's hard to do alone
The public data lags. NJDOT's raw crash data stops at 2022, FARS 2024 is preliminary, and FMCSA's current year is incomplete. None of it will tell you what happened in your crash.
Your case runs on two records these tables do not contain: the police crash report, with the responsible carrier's USDOT number in Boxes 50–52, and the carrier's own files, which federal rules let it discard on a schedule (electronic logs after six months, inspection reports after three).
The carrier's history is public but scattered. Its crash and inspection record sits in FMCSA's systems under its USDOT number, not under the name painted on the truck.
Garces, Grabler & LeBrocq, P.C.
What GGL does for you here
Pulls the carrier's FMCSA crash and inspection history by USDOT number from the police report, for your case rather than for the county
Orders the police report and, where needed, the State Police serious/fatal file by subpoena
Sends the trucking company a preservation letter before its records can be discarded
Identifies the responsible carrier, broker, lessor and insurer
Call Today For A Free Consultation
The numbers describe the county. Your case depends on your report and the carrier's records. Call (201) 252-7848. No Fee Unless GGL Wins.